Error: 'not/a/file.csv' does not exist in current working directory ('/home/runner/work/programming-r/programming-r').useR to programmeR
Iteration 2
Emma Rand and Ian Lyttle
Learning objectives
In this session, we will discuss:
- using
purrr::map()to read a bunch of files - using
purrr::walk()to write a bunch of files - functional programming, more generally
For coding, we will use r-programming-exercises:
-
R/iteration-02-01-reading-files.R, etc. - restart R
Reading multiple files
Using {purrr} to iterate can help you perform many tasks repeatably and reproducibly.
Example
Read Excel files from a directory, then combine into a single data-frame.
Aside: {here} package
When you first call here::here(), (simplified):
- climbs your local directory until it finds a
.RProjfile - sets directory containing
.RProjas reference-path -
here::here()prepends reference-path to argument
If project in /Users/ian/important-project/:
here("data/file.csv")"/Users/ian/important-project/data/file.csv"Our turn
In the programming-r-exercises repository:
- open
iteration-02-01-reading-files.R - restart R
Our turn: reading data manually
Here’s our starting code:
data1952 <- read_excel(here("data/gapminder/1952.xlsx"))
data1957 <- read_excel(here("data/gapminder/1957.xlsx"))
data1962 <- read_excel(here("data/gapminder/1952.xlsx"))
data1967 <- read_excel(here("data/gapminder/1967.xlsx"))

data_manual <- bind_rows(data1952, data1957, data1962, data1967)
What problems do you see?
(I see two real problems, and one philosophical problem)
Run this example code, discuss with your neighbor.
Our turn: make list of paths
I see this as a two step problem:
- make a named list of paths, name is year
- use list of paths to read data frames, combine
Our turn: read data
Let’s work together to improve this code to read data:
data <-
  paths |>
  # read each file from excel, into data frame
  # keep only non-null elements
  # set list-names as column `year`
  # bind into single data-frame
  # convert year to number
  print()
Handling failures
If we have a failure, we may not want to stop everything.
Function operators
Function operators:
- take a function
- return a modified function
poss_read_csv("not/a/file.csv")Error: 'not/a/file.csv' does not exist in current working directory ('/home/runner/work/programming-r/programming-r').NULLposs_read_csv(I("a, b\n 1, 2"), col_types = "dd")# A tibble: 1 × 2
a b
<dbl> <dbl>
1 1 2Our turn: handle failure
In the programming-r-exercises repository:
- look at
data/gapminder_party/ - try running your script using this directory
Create a new function:
possibly_read_excel <- possibly() # we do the restUse this function in your script.
If we have time
Functional programming has three fundamental operations:
-
filter()- like spaghetti, not coffee:purrr::keep() -
map()- do this to each element:purrr::map() -
reduce()- combine into new thing:purrr::reduce()
Functional sandwiches
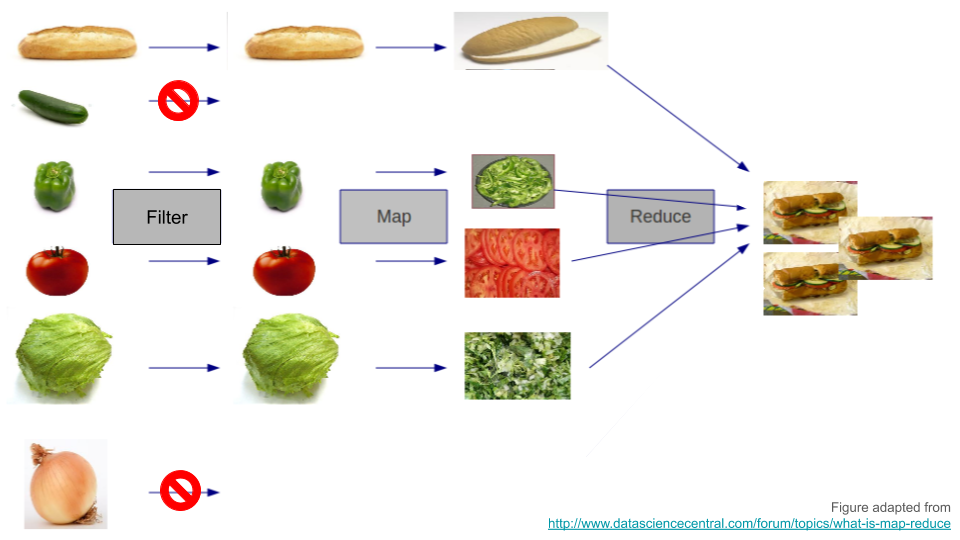
Horrible example
Implement list_rbind() using functional-programming techniques:
list_rbind2 <- function(df, names_to) {
  df |>
    purrr::keep(\(x) !is.null(x)) |>
    purrr::imap(\(d, name) dplyr::mutate(d, "{names_to}" := name)) |>
    purrr::reduce(rbind)
}-
filters in not-
NULLvalues,purrr::keep() -
maps name of element to data-column,
purrr::imap() -
reduces list to single data-frame,
purrr::reduce()
Our turn: saving multiple outputs
Goal: write out a csv file for each value of clarity within ggplot2’s diamonds dataset.
When we read “for each”, we might think of using map():
Writing out a file is a side effect.
We aren’t interested in the return value.
{purrr} has a function for that: walk() (and friends).
Our turn - starter code
iteration-02-02-writing-files.R
# ?dplyr::group_nest(), ?stringr::str_glue()
# from diamonds, create tibble with columns: clarity, data, filename
by_clarity_csv <-
  diamonds |>
  # nest by clarity
  # create column for filename
  print()

# ?readr::write_csv()
# using the data and filename, write out csv files
walk2(
  by_clarity_csv$data,
  by_clarity_csv$filename,
  \(data, filename) NULL # replace with actual code
)
Our turn: writing multiple plots
Goal: Save histogram for carat for each value of clarity within diamonds dataset.
Create a plot column, where each element is a ggplot. This will be a list-column.
You can use map():
- within
mutate(), with all the tidy-eval goodness! - with additional arguments (after the function), e.g.:
mutate(
  plot = map(data, histogram, carat)
)
equivalent to
plot[[1]] = histogram(data[[1]], carat)
plot[[2]] = histogram(data[[2]], carat)
...
Our turn: starter-code
# from diamonds, create tibble with columns: clarity, data, plot, filename
by_clarity_plot <-
  diamonds |>
  # nest by clarity
  group_nest(clarity) |>
  # create columns for plot, filename
  mutate(
    filename = str_glue("clarity-{clarity}.png")#,
    #plot = map(),
  ) |>
  print()
Our turn: more starter-code
# ?ggplot2::ggsave()
ggsave_local <- function(filename, plot) {

}

# using filename and plot, write out plots to png files
walk2(
  by_clarity_plot$filename,
  by_clarity_plot$plot,
  # write plot file to data/clarity directory
  ggsave_local
)
Functions as arguments
library("tidyverse")
library("palmerpenguins")

ggplot(penguins, aes(x = bill_length_mm, y = bill_depth_mm, color = species)) +
  geom_point() +
  scale_color_discrete(labels = tolower) # tolower is a function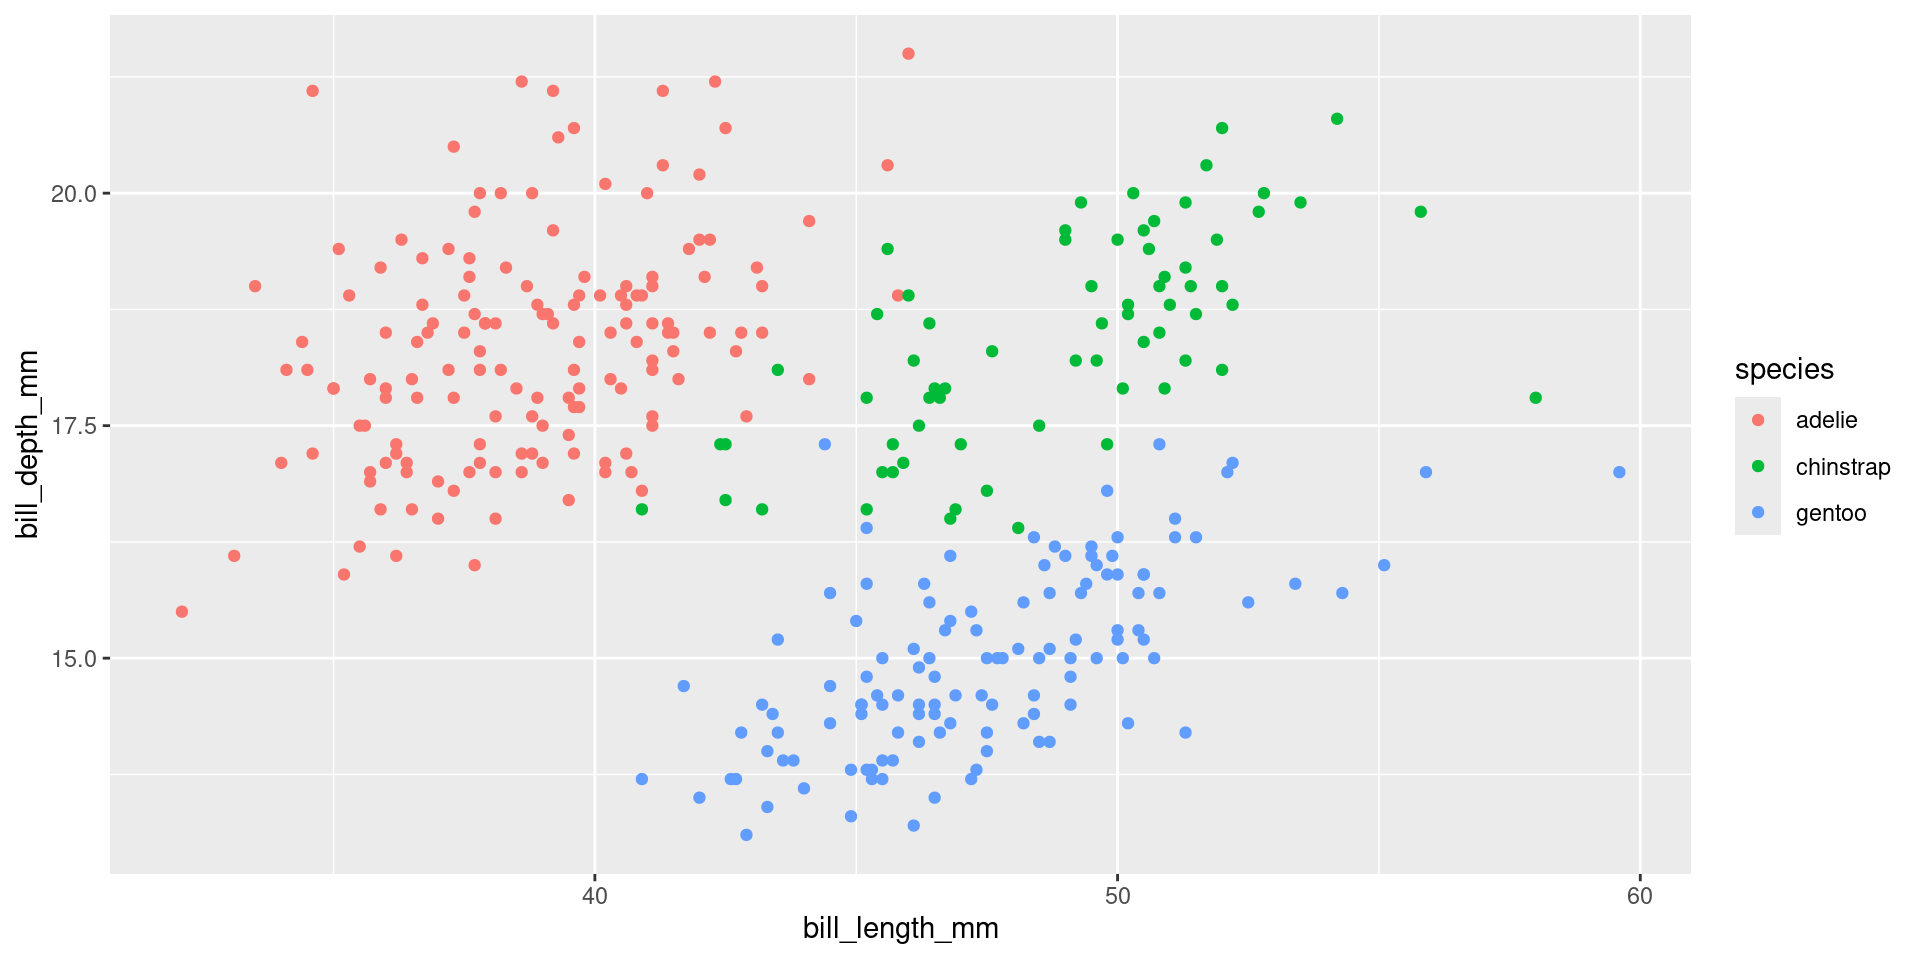
If we have time (2)
Three fundamental operations in functional programming
Given a list and a function:
dplyr using purrr?
We can use map(), filter(), reduce() to “implement”, using purrr:
I claim it’s possible, I don’t claim it’s a good idea.
Tabular data: two perspectives
dpurrr_filter()
dpurrr_filter <- function(df, predicate) {
  df |>
    as.list() |>
    purrr::list_transpose(simplify = FALSE) |>
    purrr::keep(predicate) |>
    purrr::list_transpose() |>
    as.data.frame()
}dpurrr_filter(mtcars, \(d) d$gear == 3) |> head() mpg cyl disp hp drat wt qsec vs am gear carb
1 21.4 6 258.0 110 3.08 3.215 19.44 1 0 3 1
2 18.7 8 360.0 175 3.15 3.440 17.02 0 0 3 2
3 18.1 6 225.0 105 2.76 3.460 20.22 1 0 3 1
4 14.3 8 360.0 245 3.21 3.570 15.84 0 0 3 4
5 16.4 8 275.8 180 3.07 4.070 17.40 0 0 3 3
6 17.3 8 275.8 180 3.07 3.730 17.60 0 0 3 3dpurrr_mutate()
dpurrr_mutate <- function(df, mapper) {
  df |>
    as.list() |>
    purrr::list_transpose(simplify = FALSE) |>
    purrr::map(\(d) c(d, mapper(d))) |>
    purrr::list_transpose() |>
    as.data.frame()
} mpg cyl disp hp drat wt qsec vs am gear carb wt_kg
1 21.0 6 160 110 3.90 2.620 16.46 0 1 4 4 1190.909
2 21.0 6 160 110 3.90 2.875 17.02 0 1 4 4 1306.818
3 22.8 4 108 93 3.85 2.320 18.61 1 1 4 1 1054.545
4 21.4 6 258 110 3.08 3.215 19.44 1 0 3 1 1461.364
5 18.7 8 360 175 3.15 3.440 17.02 0 0 3 2 1563.636
6 18.1 6 225 105 2.76 3.460 20.22 1 0 3 1 1572.727dpurrr_summarise()
dpurrr_summarise <- function(df, reducer, .init) {
  df |>
    as.list() |>
    purrr::list_transpose(simplify = FALSE) |>
    purrr::reduce(reducer, .init = .init) |>
    as.data.frame()
}With grouping
First, a little prep work:
Et voilà
mtcars |>
  split(mtcars$gear) |>
  purrr::map(summariser) |>
  ireduce(
    reducer = \(acc, x, y) rbind(acc, c(list(gear = y), x)),
    .init = data.frame()
  )
gear wt_min wt_max
1 3 2.465 5.424
2 4 1.615 3.440
3 5 1.513 3.570We can agree this presents no danger to dplyr.
In JavaScript, data frames are often arrays of objects (lists), so you’ll see formulations like this (e.g. tidyjs).
Summary
- you can use
purrr::map()to read a bunch of files - you can use
purrr::walk()to write a bunch of files - functional programming has three foundational operations:
- filter (
purrr::keep()) - map
- reduce
- filter (
Functional programming comes up a lot in JavaScript
Wrap-up
Please go to pos.it/conf-workshop-survey.
Your feedback is crucial!
Data from the survey informs curriculum and format decisions for future conf workshops, and we really appreciate you taking the time to provide it.
Thank you!
- Emma
- Lionel and Jonathan
- Mine Çetinkaya-Rundel, Posit
- You 🤗