Hello, dashboards!
Build-a-Dashboard Workshop
2024-08-12
Introductions

Dr. Mine Çetinkaya-Rundel
Professor, Statistical Science, Duke University
Developer Educator, Posit

Carlos Schedigger,
Software Engineer, Posit
Alex Chisholm,
Product Manager, Posit
Ron Blum,
QA Engineer, Posit
Workshop materials
One link for all materials
![]()
Asking for help
I’m stuck
I’m done

I have a general question
Step 2: Add a card
Step 3: Add another card

Step 4: Add titles to cards
Steps 1 - 4
Step 2: Add a card
Step 3: Add another card
dashboard-py.qmd
Step 4: Add titles to cards
dashboard-py.qmd
---
title: "My first Quarto dashboard"
format: dashboard
---
```{python}
from plotnine import ggplot, aes, geom_point, geom_bar
from plotnine.data import mpg
```
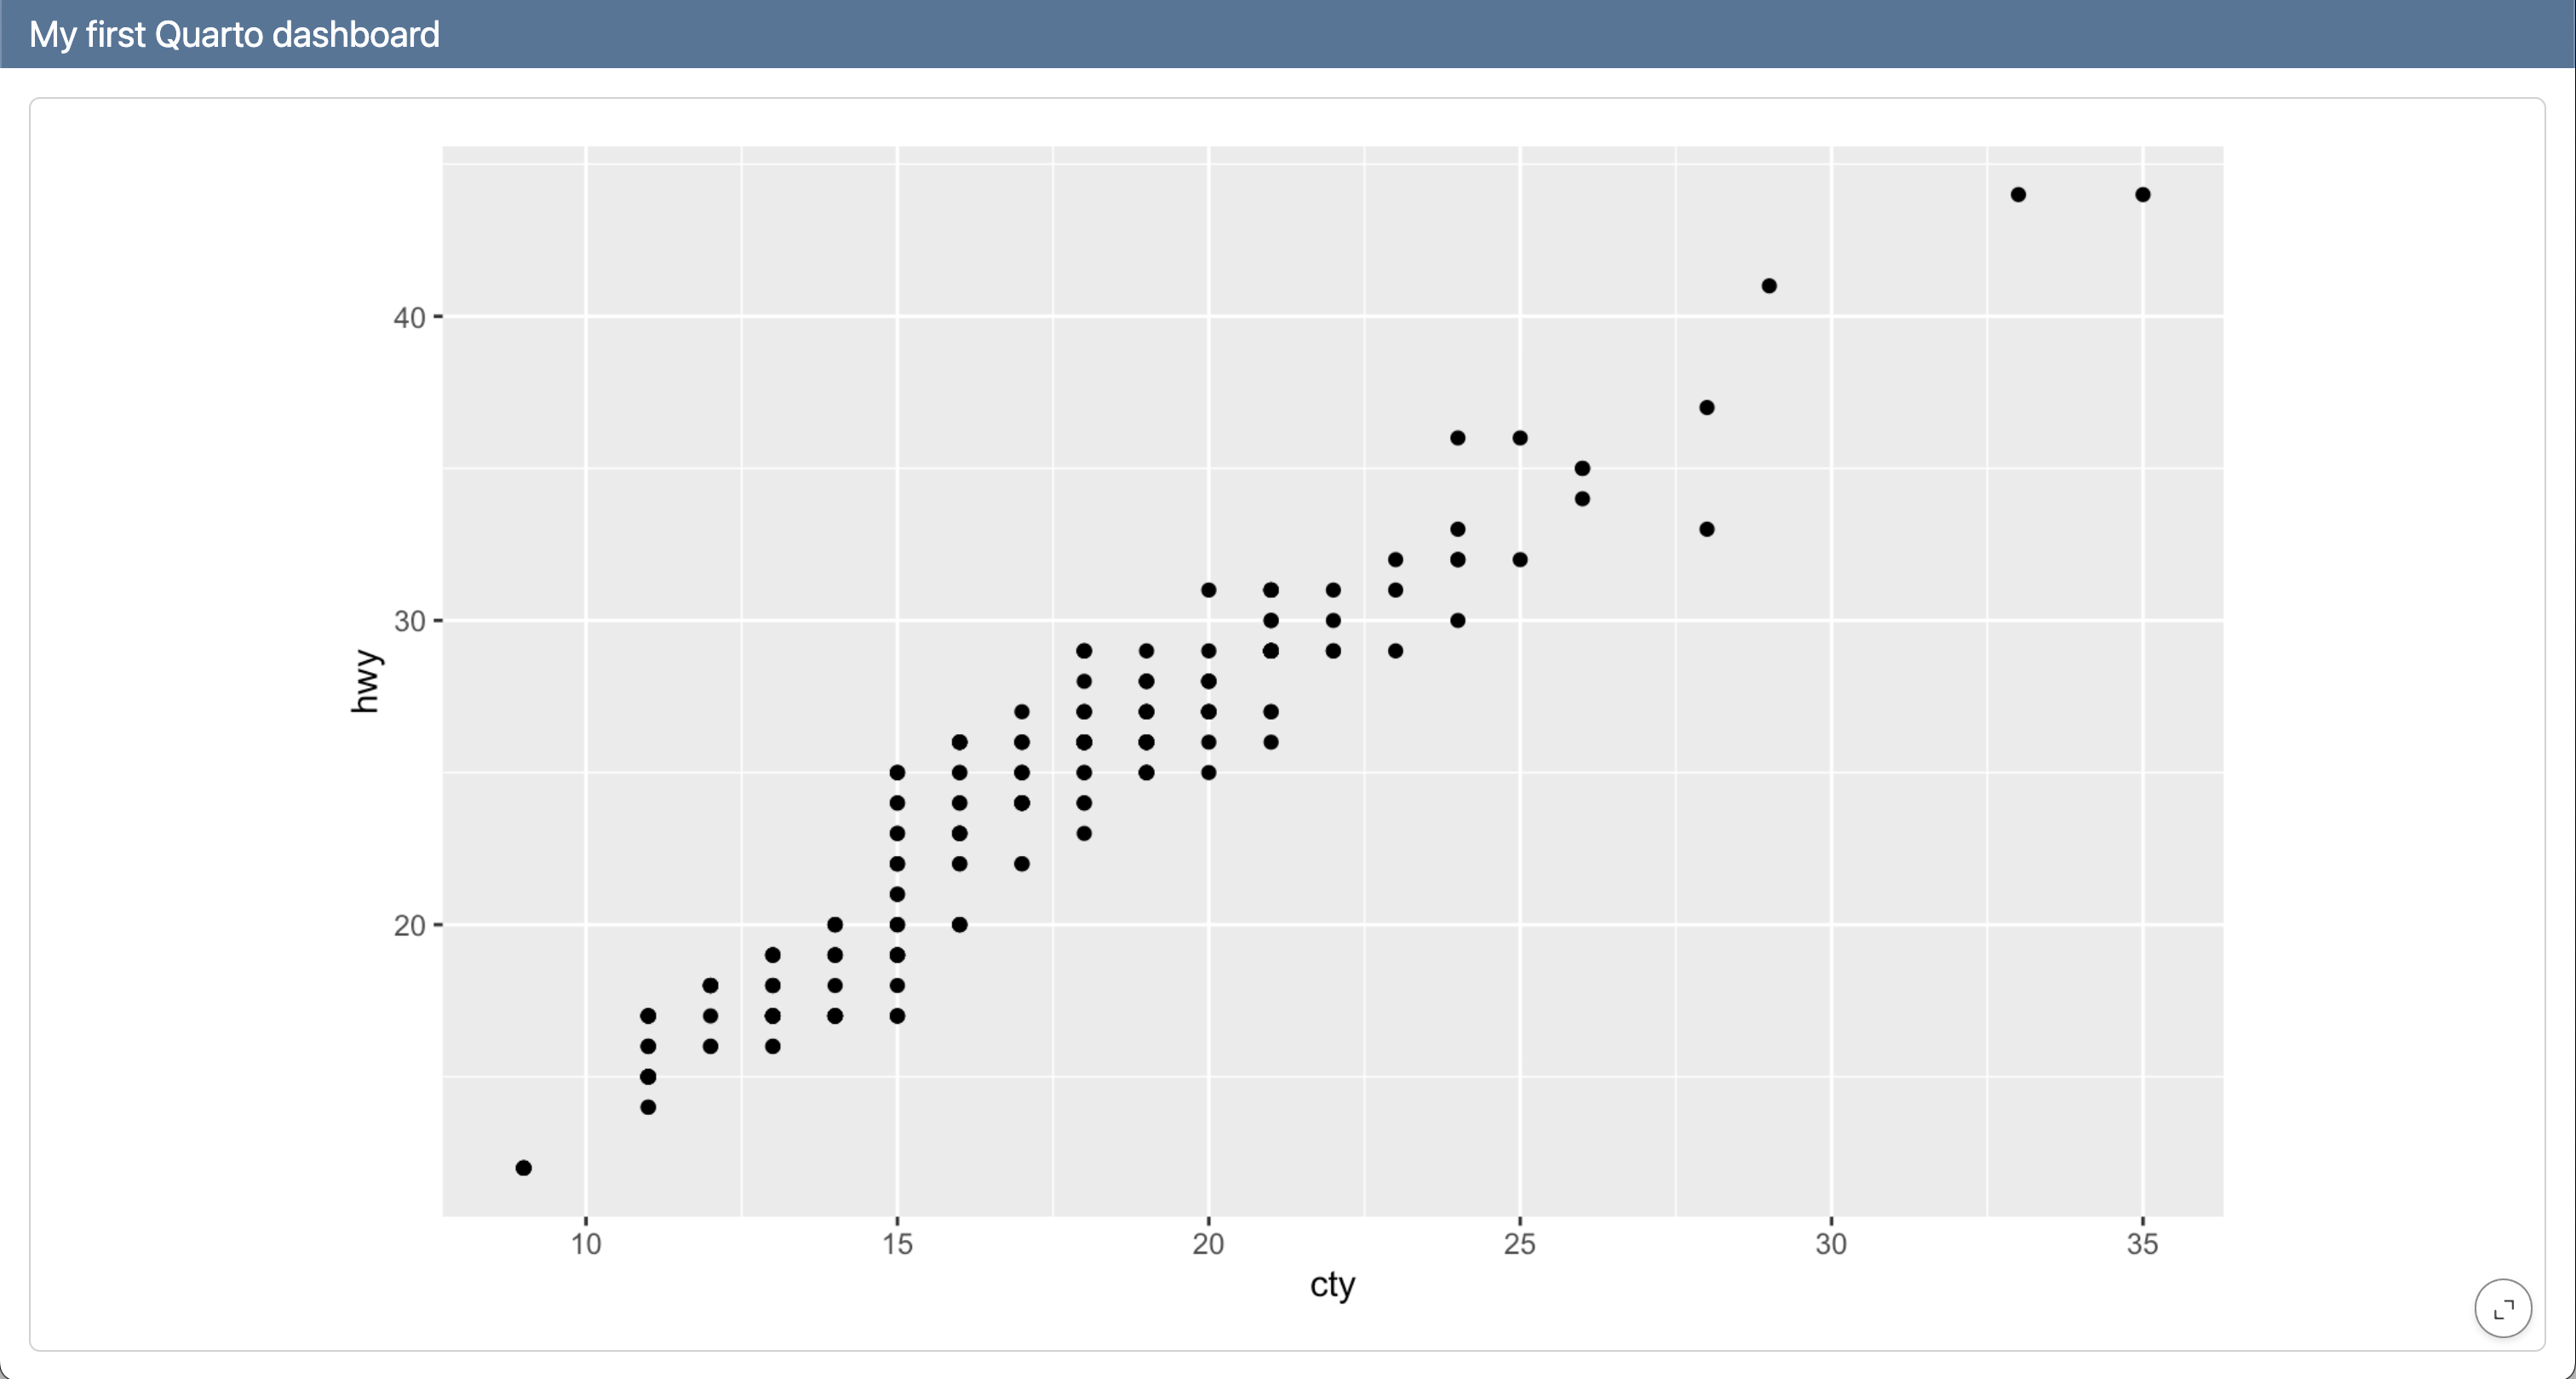
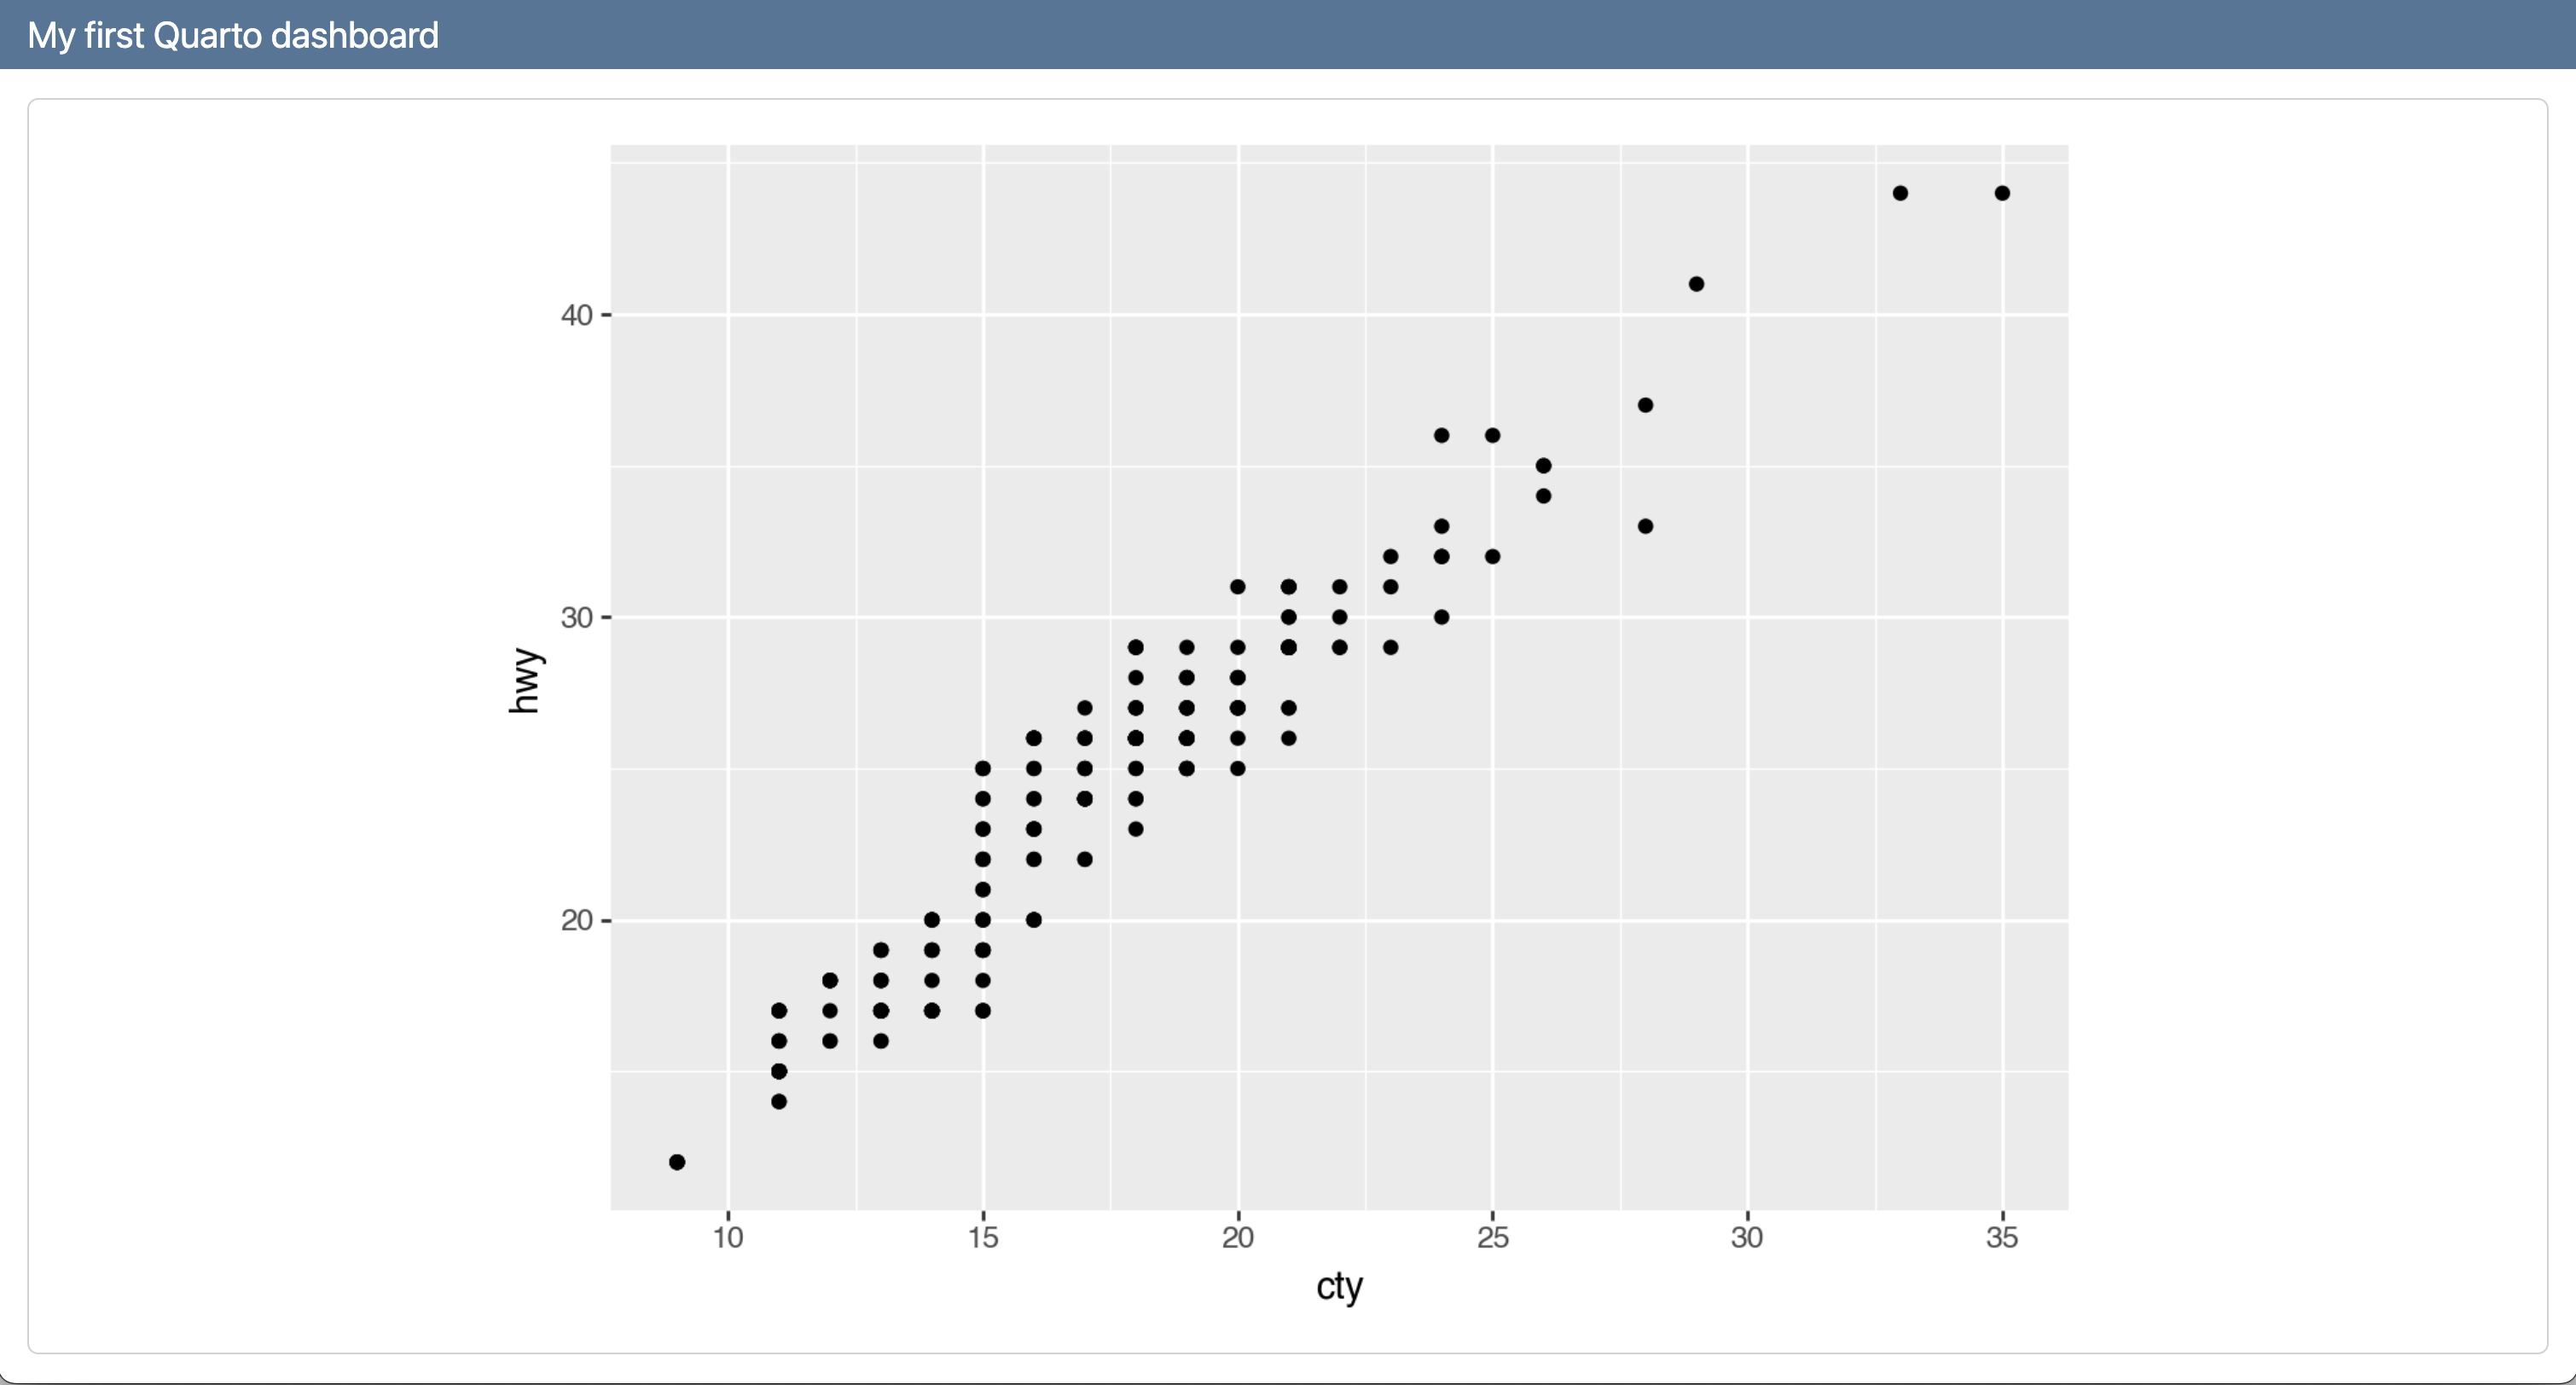
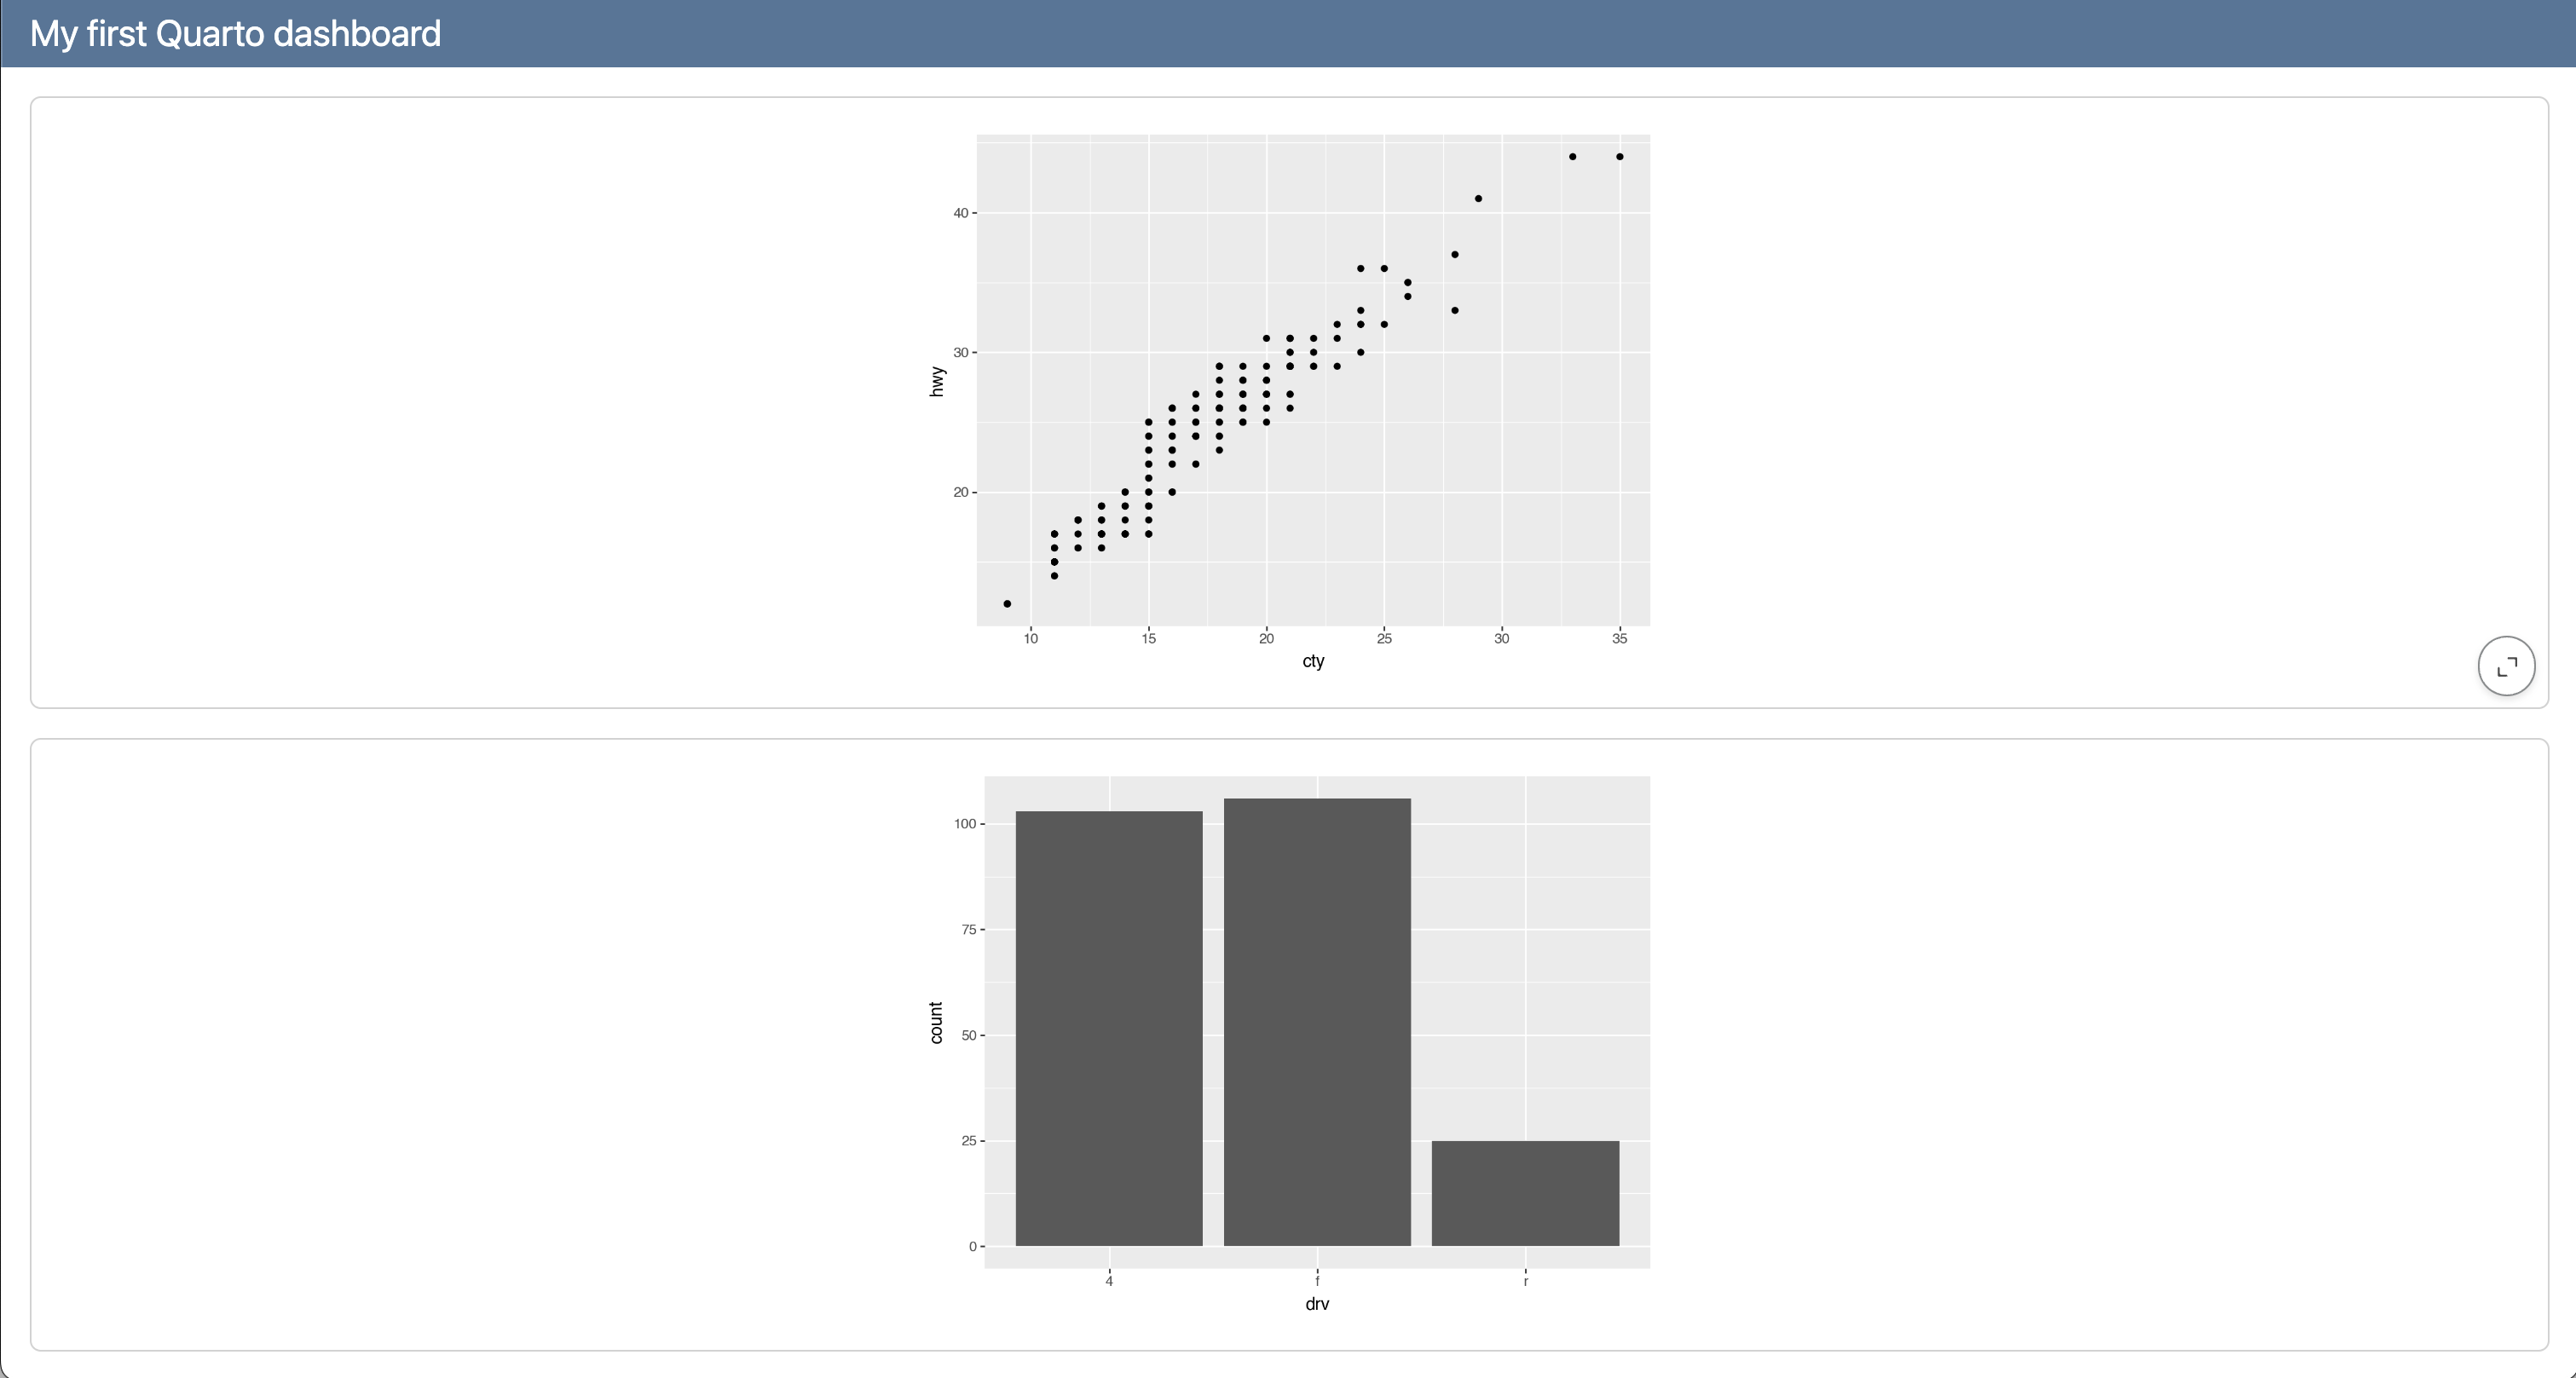
```{python}
#| title: Highway vs. city mileage
(
ggplot(mpg, aes(x = "cty", y = "hwy"))
+ geom_point()
)
```
```{python}
#| title: Drive types
(
ggplot(mpg, aes(x = "drv"))
+ geom_bar()
)
```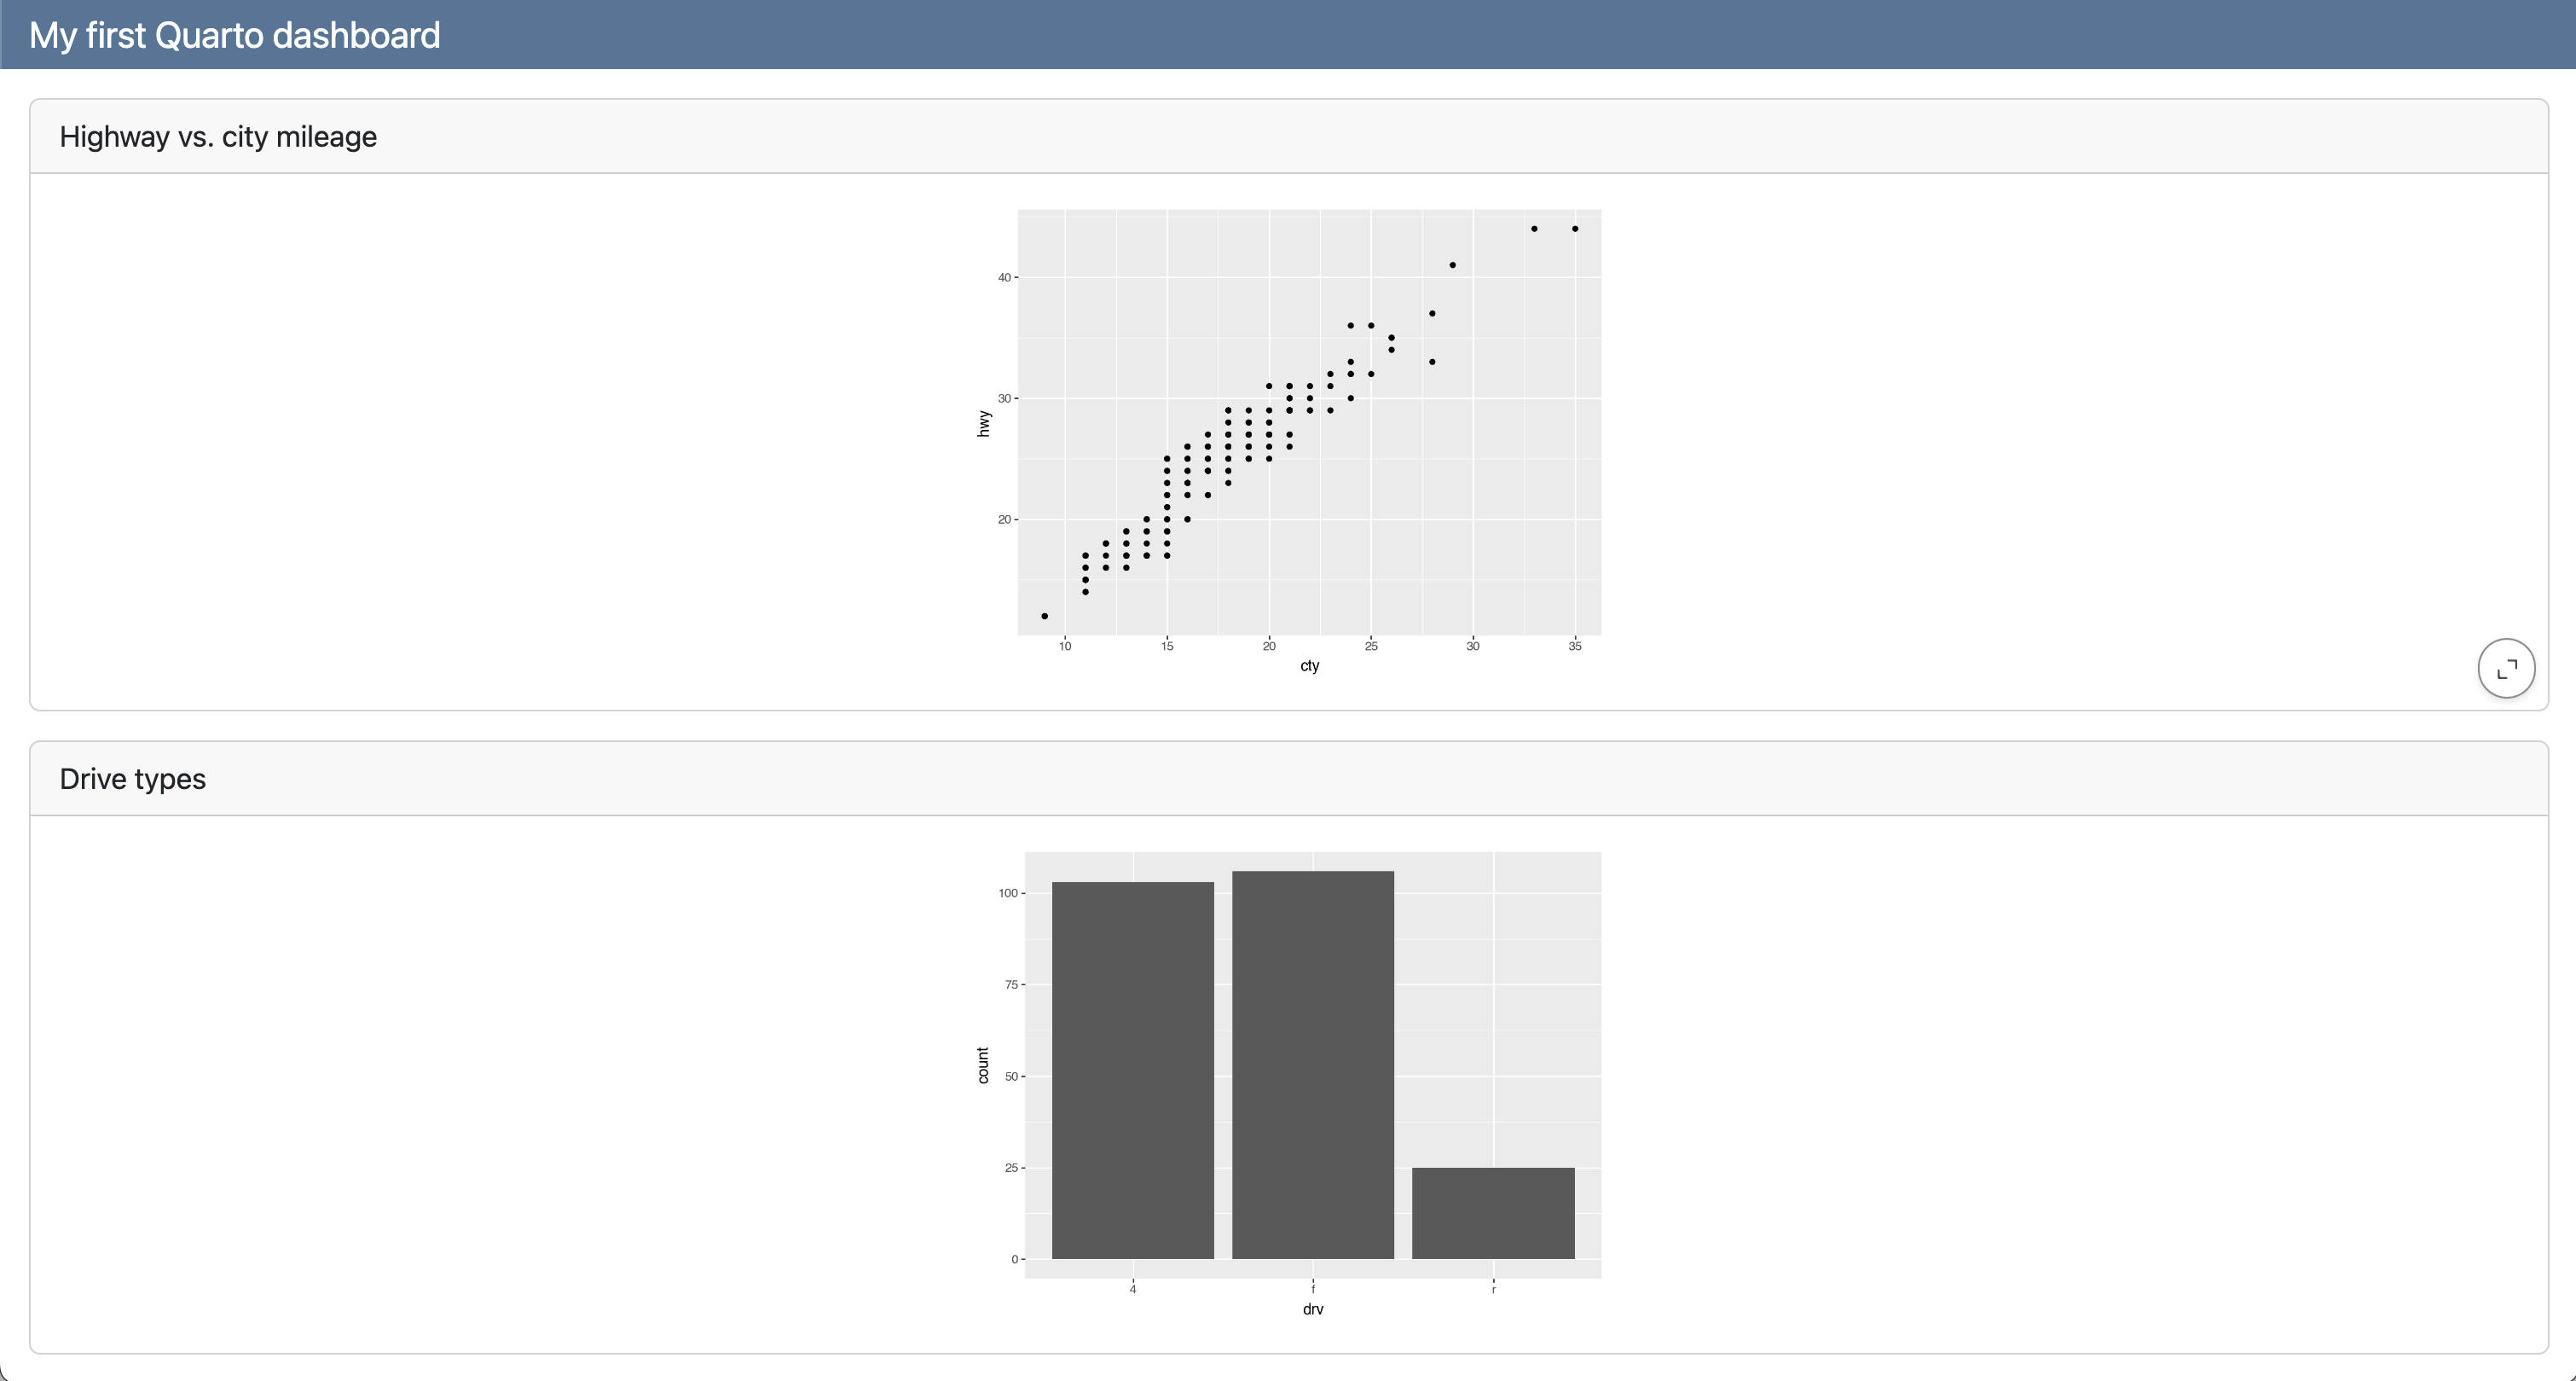
Steps 1 - 4
Goal
Your goal is to create one of the following dashboards.
Step 1
- Turn the output to a dashboard.
- Add
titles to code cells.
05:00
Step 2
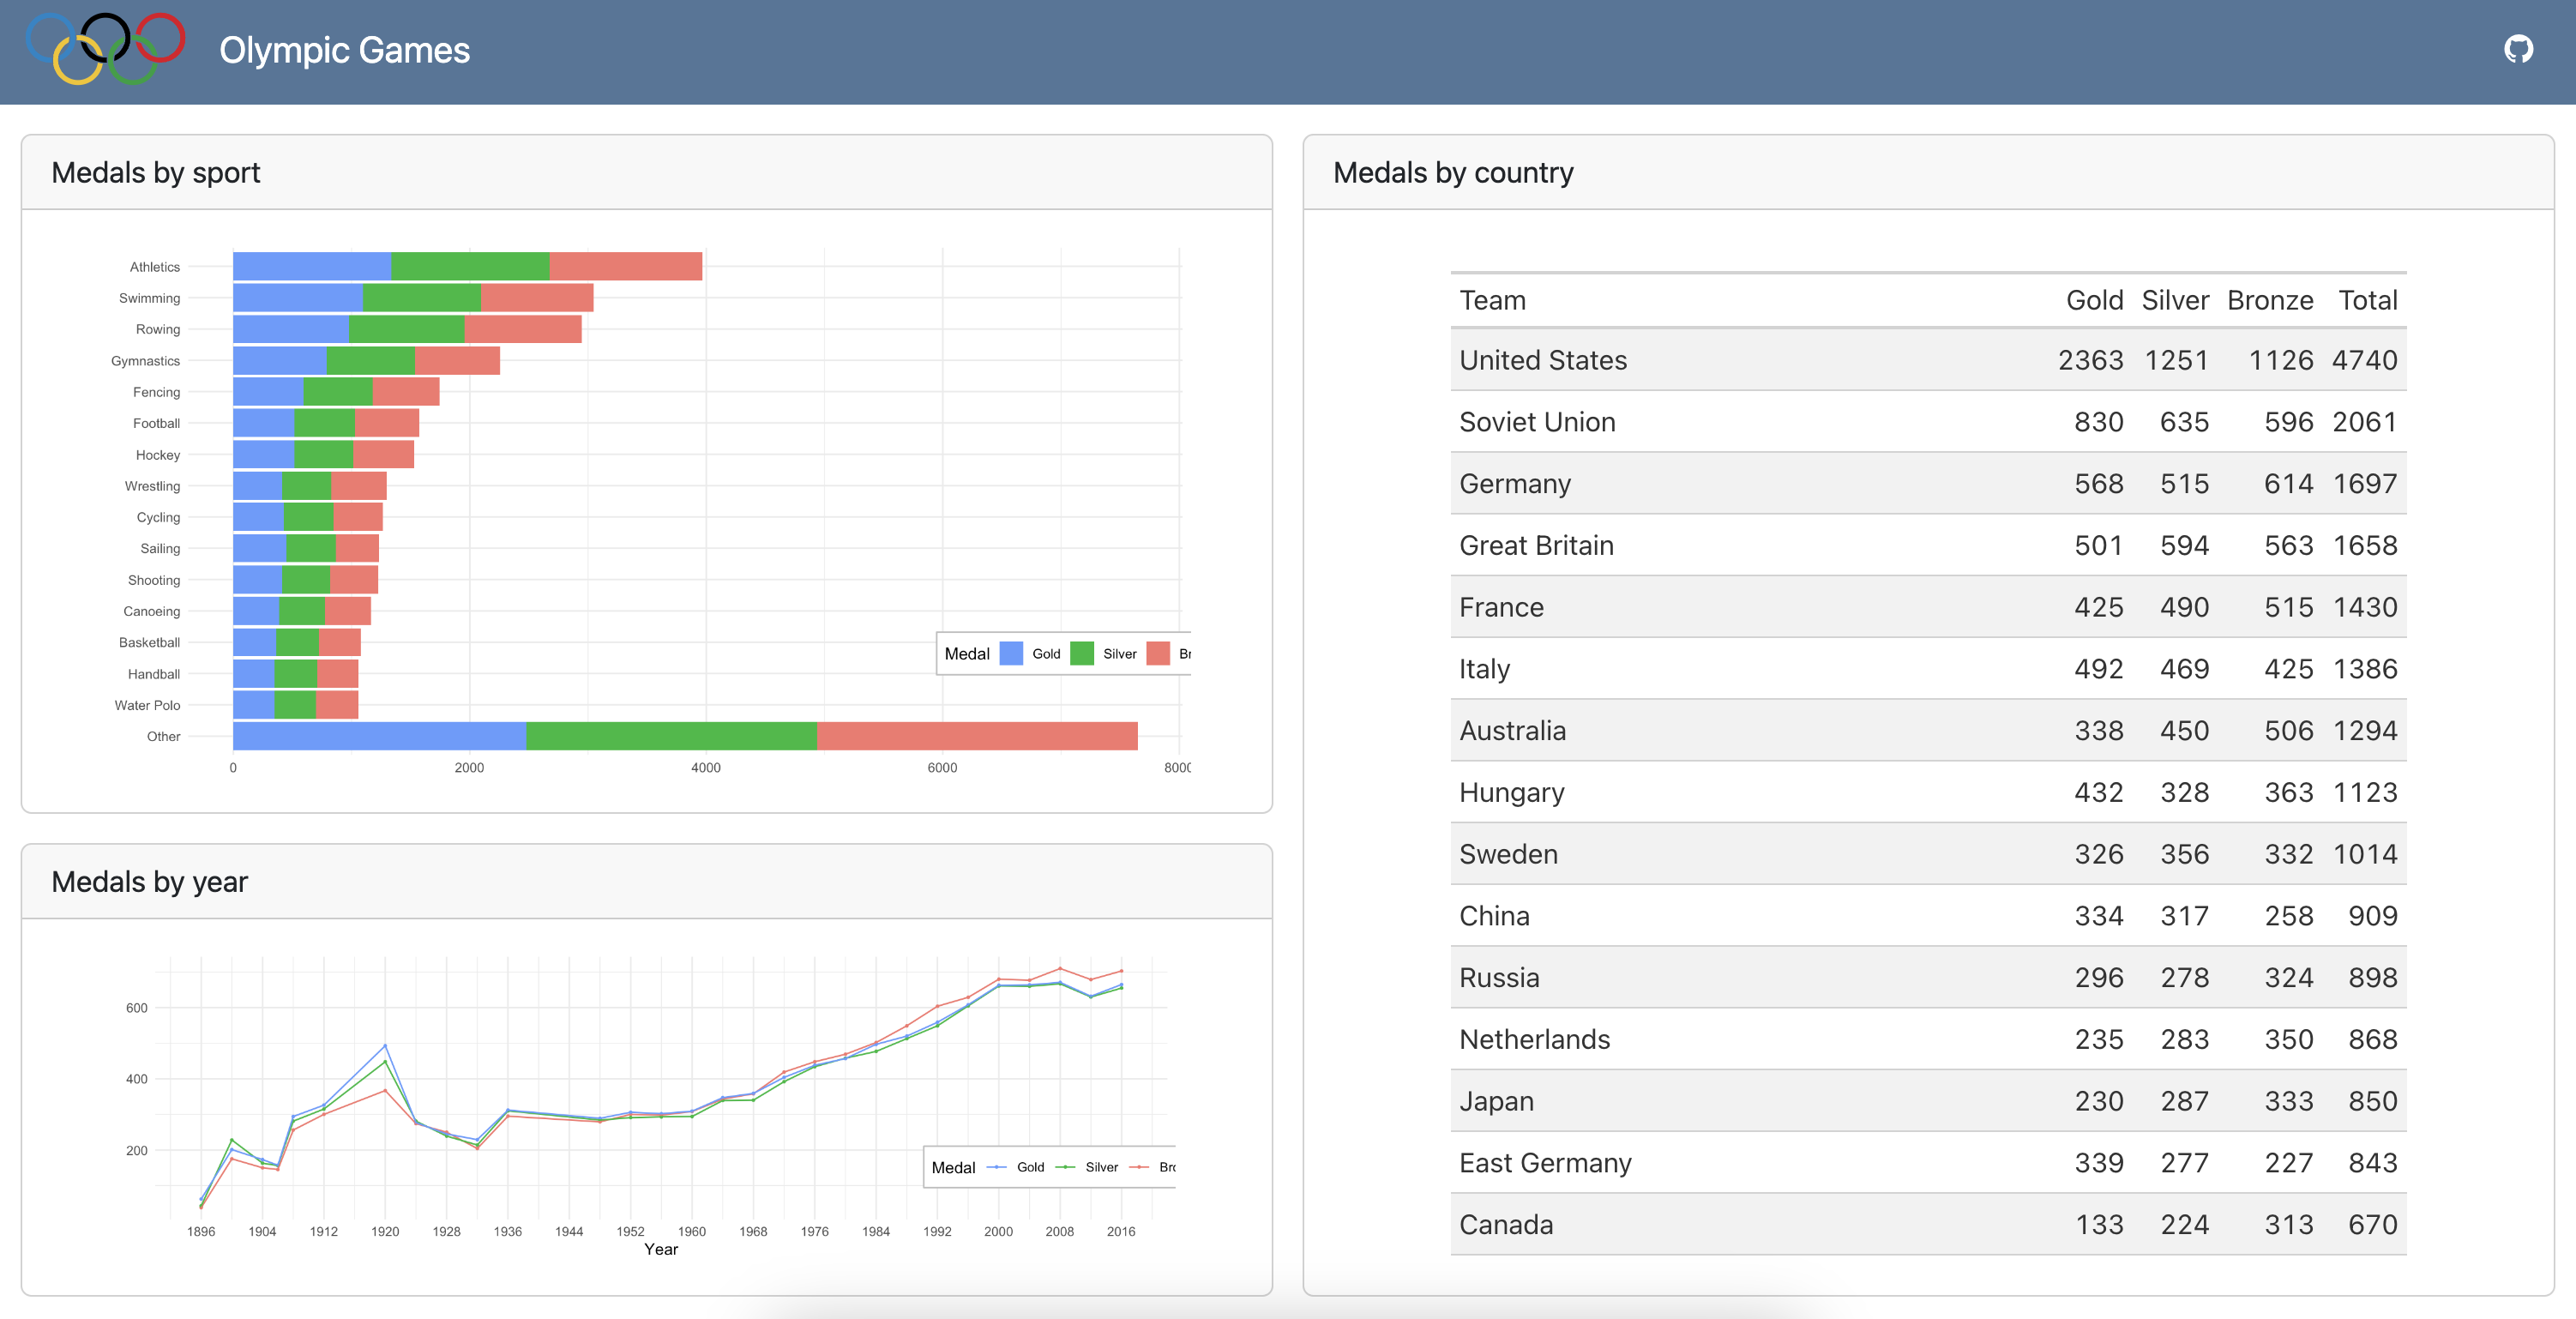
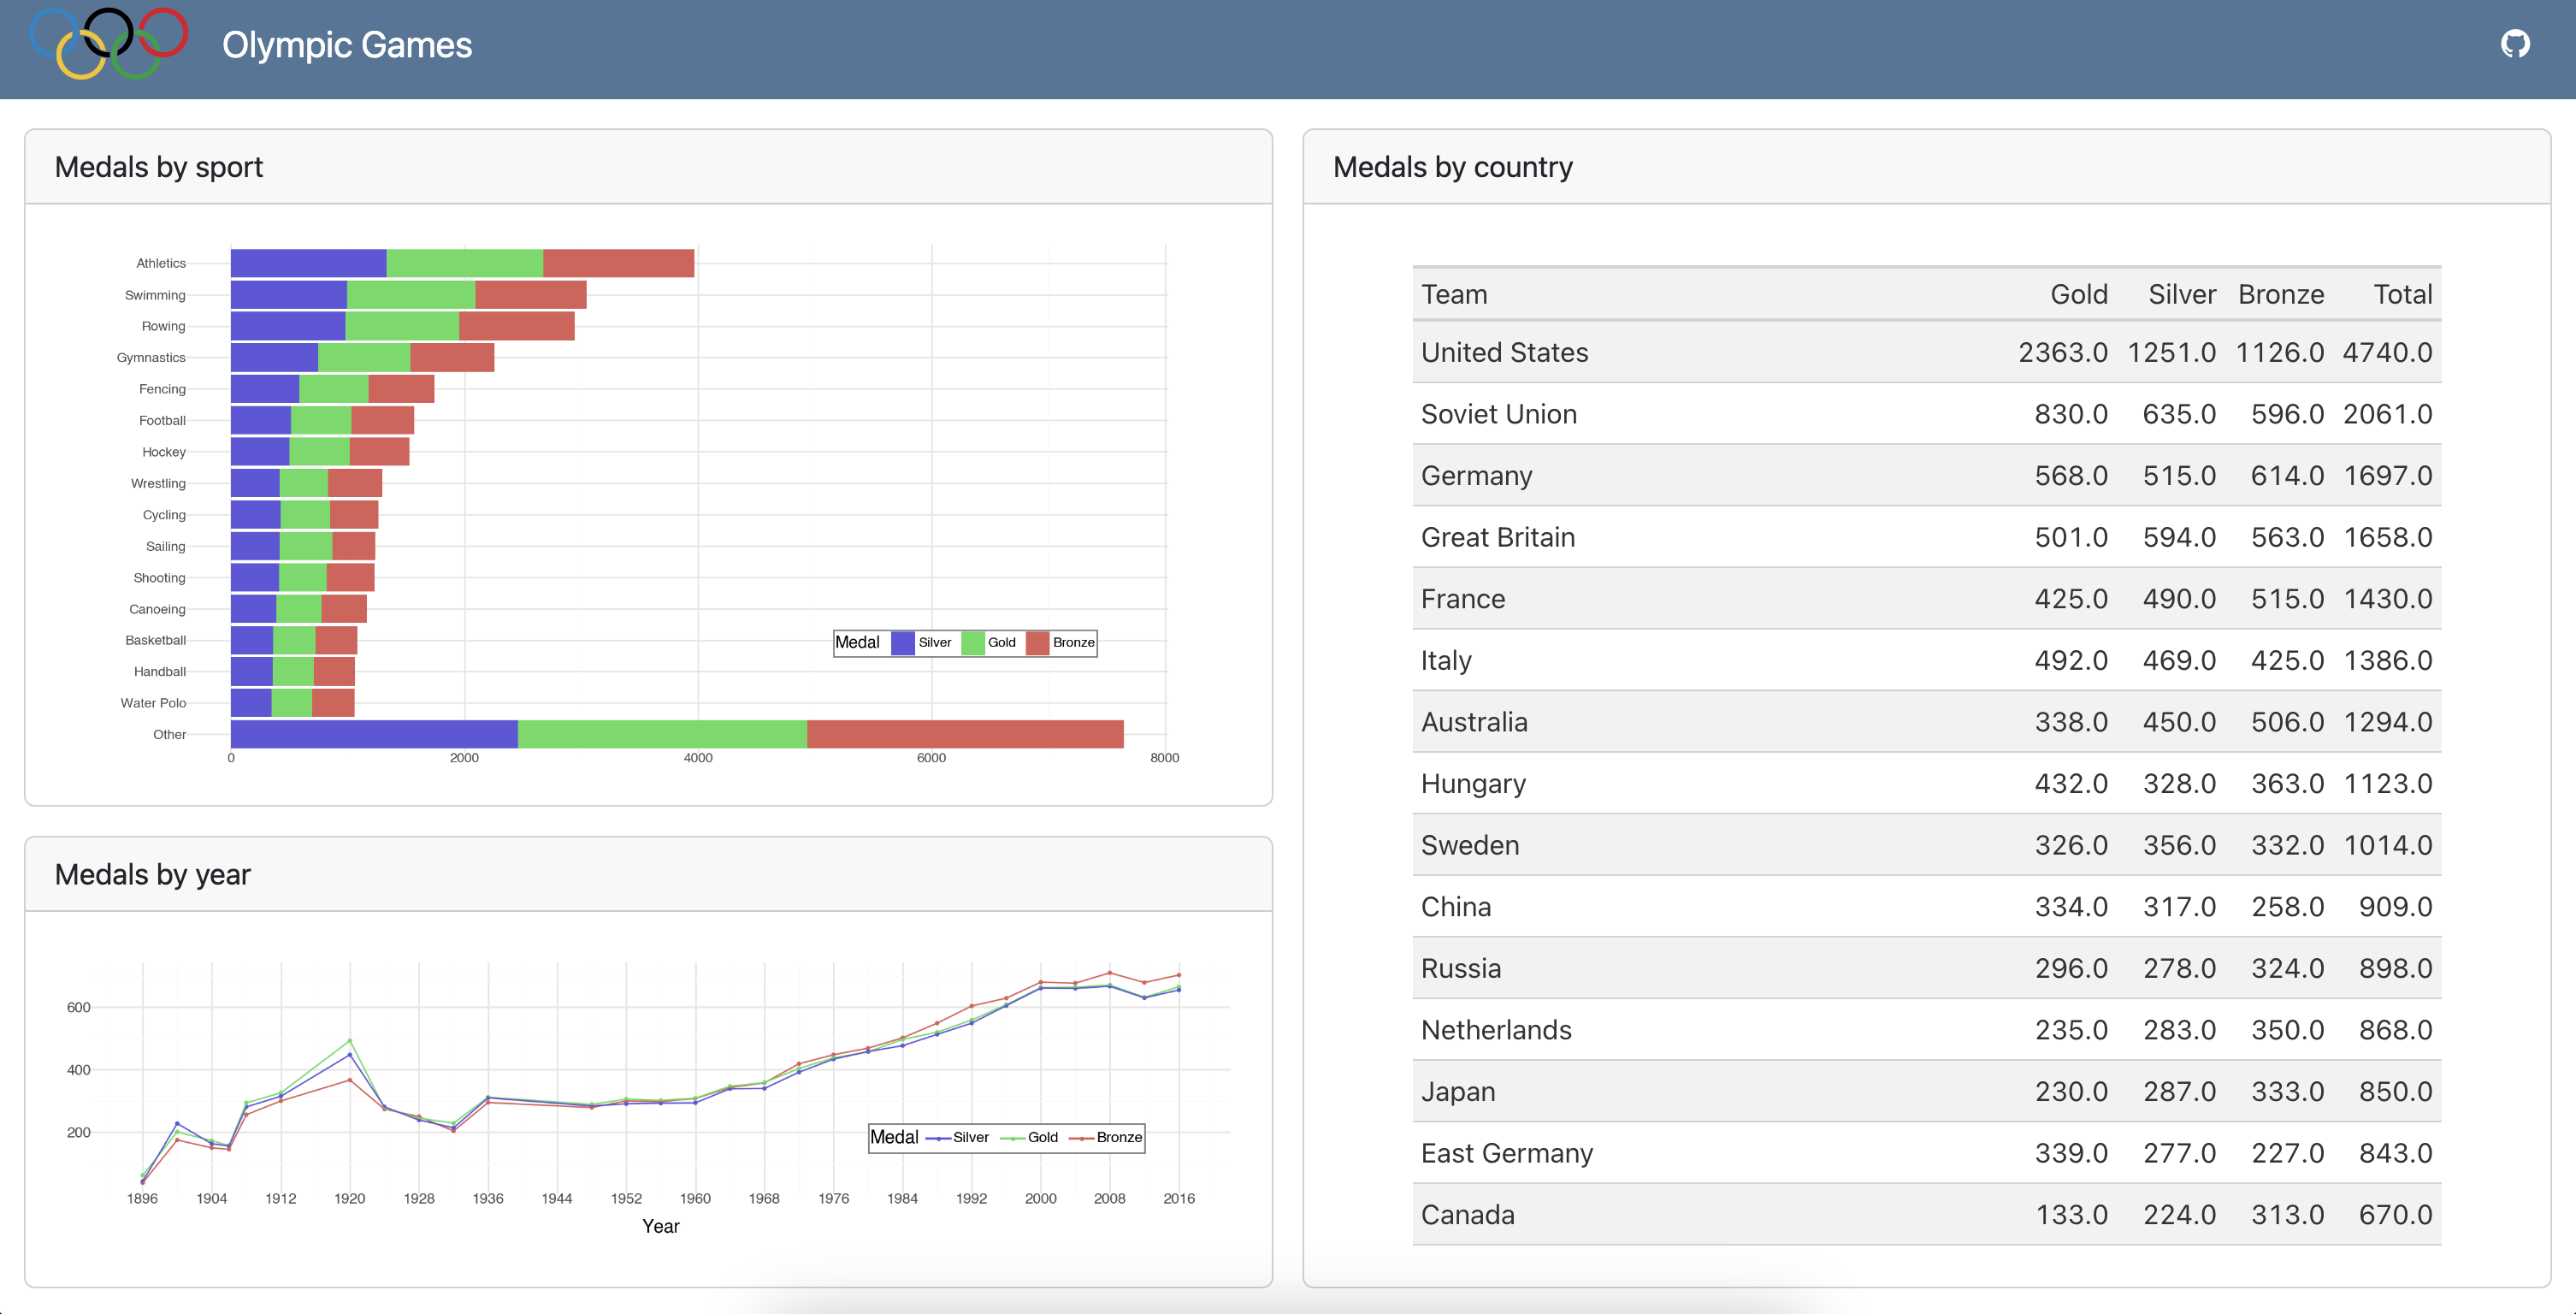
- Add a GitHub icon and link to a GitHub repository (that may or may not contain the code for the dashboard you’re building).
- Add the olympics logo from the
imagesfolder.
05:00
Step 3
Reorganize the cards into rows and columns as shown below.
05:00
![]()