

03:00
1 - Introduction
Intro to MLOps with vetiver
Welcome!
Wi-Fi network name
Posit Conf 2024
Wi-Fi password
conf2024
Welcome!
- There are gender-neutral bathrooms located on levels 3, 4, 5, 6, & 7
- A meditation/prayer room is available in room 503
- Open Monday & Tuesday 7am - 7pm, Wednesday 7am - 5pm
- A lactation room is available in room 509
- Open Monday & Tuesday 7am - 7pm, Wednesday 7am - 5pm
- Participants who do not wish to be photographed have red lanyards; please note everyone’s lanyard colors before taking a photo and respect their choices
- The Code of Conduct can be found at https://posit.co/code-of-conduct/
- Please review them carefully! ❤️
- You can report Code of Conduct violations in person, by email, or by phone; see the policy linked above for contact information
Who are you?
You have intermediate R or Python knowledge
You can read data from CSV and other flat files, transform and reshape data, and make a wide variety of graphs
You can fit a model to data with your modeling framework of choice wide variety of graphs
You have exposure to basic modeling and machine learning practice
You do not need expert familiarity with advanced ML or MLOps topics
Who are we?
Asking for help
🧡 “I’m stuck and need help!”
💙 “I finished the exercise”
If you prefer, post on GitHub Discussions for help:
Plan for this workshop
- Versioning
- Managing change in models ✅
- Deploying
- Putting models in REST APIs 🎯
- Monitoring
- Tracking model performance 👀
Introduce yourself to your neighbors 👋
Optional
Post an introduction on GitHub Discussions: https://github.com/posit-conf-2024/vetiver/discussions
What is machine learning?
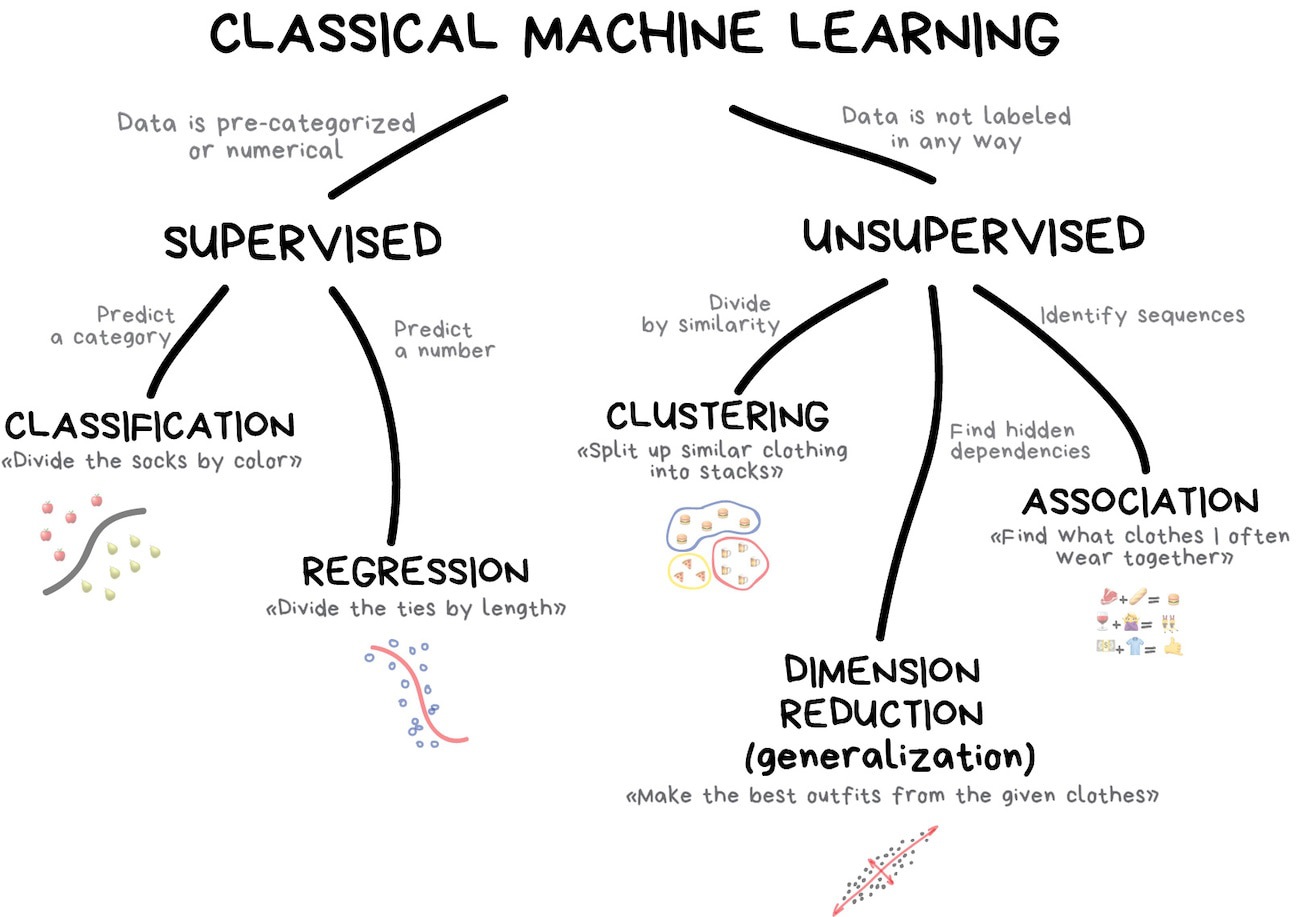
Illustration credit: https://vas3k.com/blog/machine_learning/
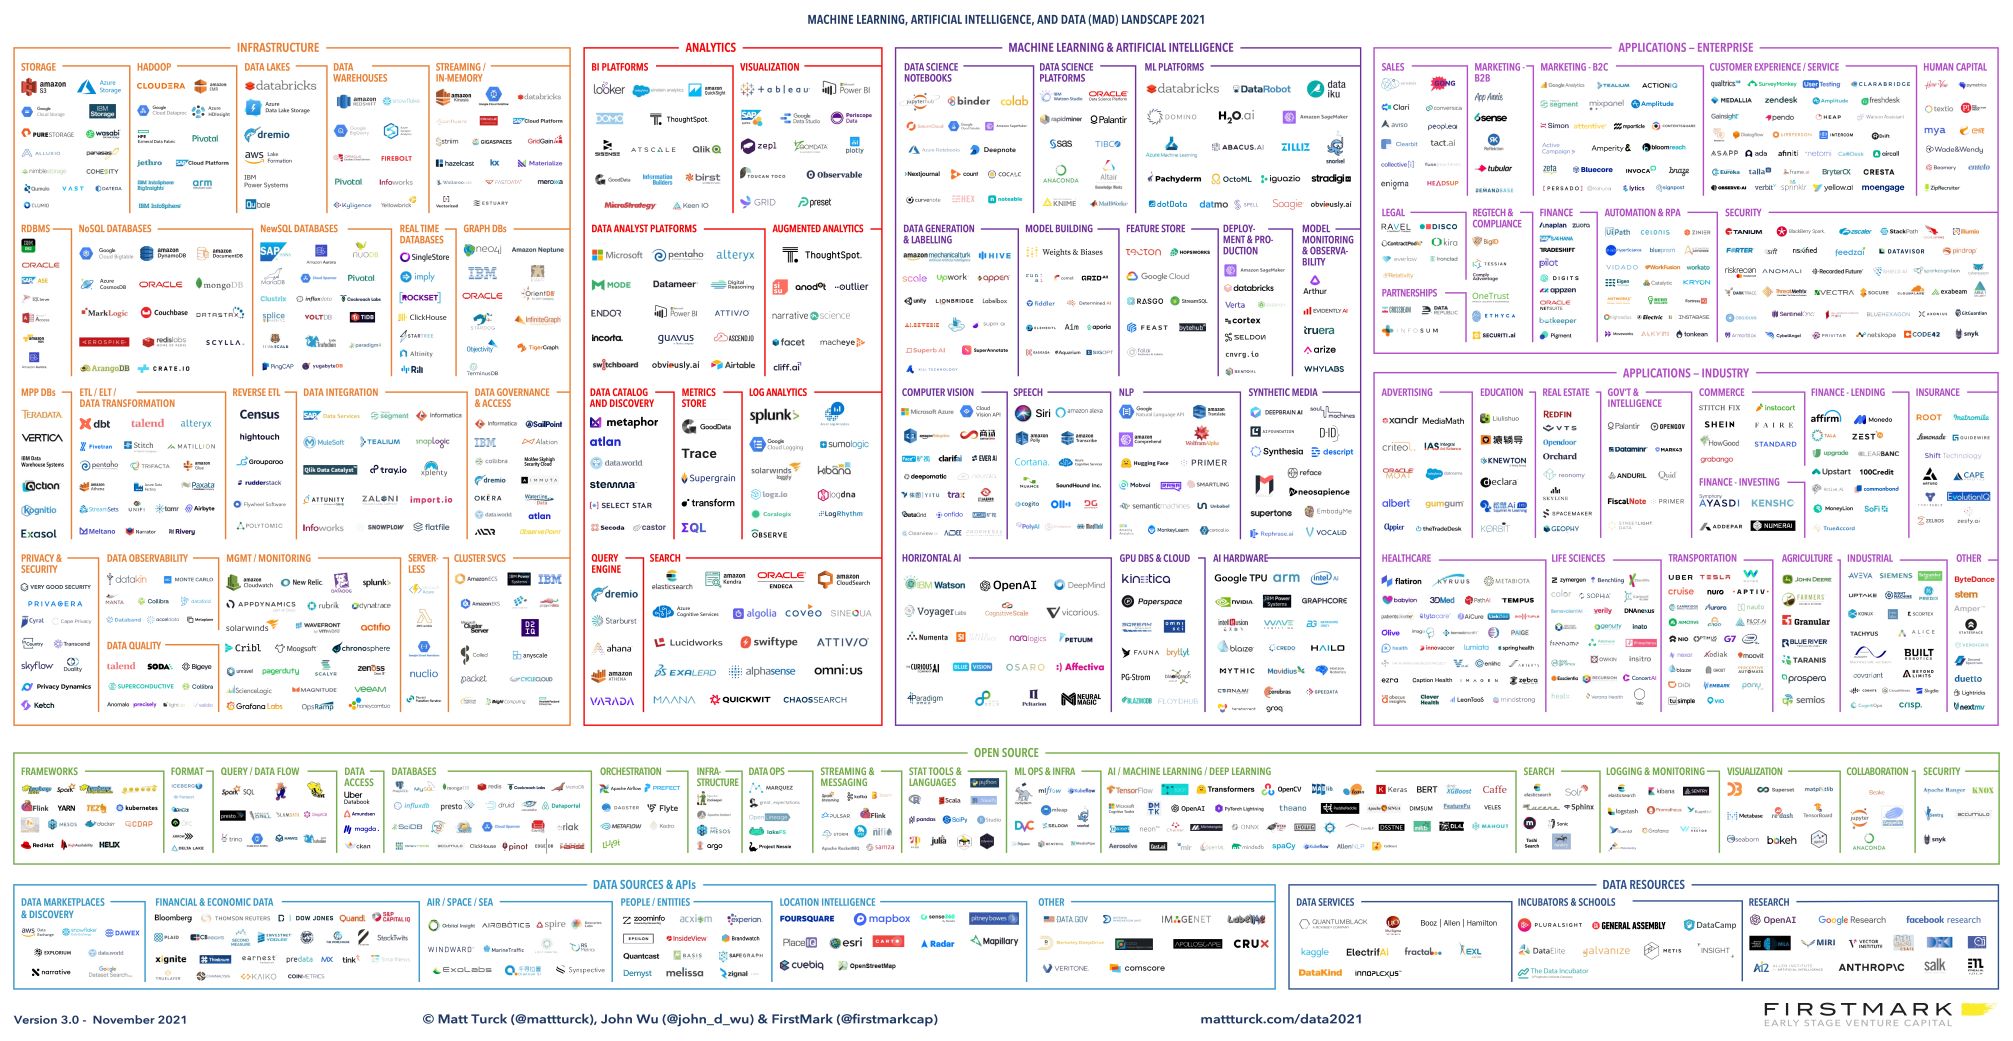
What is machine learning?

Illustration credit: Chapter 1 of Tidy Modeling with R
MLOps is…
MLOps is…
a set of practices to deploy and maintain machine learning models in production reliably and efficiently
MLOps with vetiver
Vetiver, the oil of tranquility, is used as a stabilizing ingredient in perfumery to preserve more volatile fragrances.
If you develop a model…
you can operationalize that model!
If you develop a model…
you likely should be the one to operationalize that model!
Your turn 🏺
Activity
What language does your team use for machine learning?
What kinds of models do you commonly use?
Have you ever deployed a model?
Workshop infrastructure
- Log in at https://vetiver.posit.team
- You’ll use your GitHub account to get access
- Even if you plan to work locally, set this up with us so you can use Posit Connect as a deployment target
- For Posit Workbench, use RStudio for R or VS Code for Python
- Open the folder
class-workin thevetiverdirectory
Your turn 🏺
Activity
Log in to Posit Workbench at https://vetiver.posit.team
Start a new session, either RStudio or VS Code.
We recommend that you open the vetiver directory as a project (RStudio) or workspace (VS Code).
In your new session, open the folder class-work in the vetiver directory, and choose the first Quarto file!
05:00
Seattle housing data
- Home sale prices for King County, including Seattle, between May 2014 and May 2015
- Can certain measurements be used to predict the sale price?
- Data from Kaggle by way of
mlr3data::kc_housing
Seattle housing data
N = 14633- A numeric outcome,
price - Other variables to use for prediction:
bedrooms,bathrooms,sqft_living, andyr_builtare numeric predictorswaterfrontcould be a logical (or maybe nominal) predictordatecould be a date predictor
Home prices in Seattle
| price | date | bedrooms | bathrooms | sqft_living | yr_built | waterfront | lat | long |
|---|---|---|---|---|---|---|---|---|
| 350000 | 2014-09-11 | 2 | 1.50 | 1070 | 2003 | FALSE | 47.6761 | -122.300 |
| 250275 | 2014-06-17 | 2 | 1.00 | 790 | 1942 | FALSE | 47.4413 | -122.349 |
| 712198 | 2014-05-04 | 4 | 2.50 | 2450 | 2013 | FALSE | 47.7048 | -122.113 |
| 283200 | 2014-05-26 | 4 | 2.50 | 1982 | 2004 | FALSE | 47.3636 | -122.192 |
| 435000 | 2014-11-16 | 5 | 1.00 | 2170 | 1930 | FALSE | 47.7555 | -122.204 |
| 299950 | 2014-11-17 | 3 | 2.50 | 1570 | 2005 | FALSE | 47.7456 | -121.984 |
| 368500 | 2014-12-10 | 5 | 2.75 | 2530 | 1992 | FALSE | 47.4683 | -122.263 |
| 540000 | 2014-10-06 | 5 | 1.50 | 1940 | 1940 | FALSE | 47.7213 | -122.310 |
| 299950 | 2014-10-27 | 2 | 1.75 | 1460 | 1983 | FALSE | 47.4048 | -122.178 |
| 299880 | 2014-07-08 | 3 | 2.50 | 1460 | 2000 | FALSE | 47.5440 | -122.296 |
| 545000 | 2014-07-09 | 2 | 2.00 | 2930 | 1980 | FALSE | 47.4025 | -122.463 |
| 615000 | 2014-07-21 | 3 | 3.25 | 1470 | 2003 | FALSE | 47.6516 | -122.337 |
| 680000 | 2014-06-09 | 3 | 1.75 | 1760 | 1960 | FALSE | 47.5355 | -122.390 |
| 512000 | 2014-08-07 | 4 | 2.50 | 2550 | 1996 | FALSE | 47.4836 | -122.136 |
| 452000 | 2014-06-05 | 2 | 1.75 | 1740 | 1946 | FALSE | 47.6971 | -122.282 |
Your turn 🏺
Activity
Explore the housing data on your own!
- What’s the distribution of the outcome
price? - What’s the distribution of the numeric variable
sqft_living? - How do results differ across the waterfront category?
Share something you noticed with your neighbor.
08:00


Time for building a model!

Spend your data budget
R
Python
Fit a linear regression model 🚀
Or your model of choice!
Your turn 🏺
Activity
Split your data in training and testing.
Fit a model to your training data.
05:00
Create a deployable bundle
Create a deployable model object
R
Python
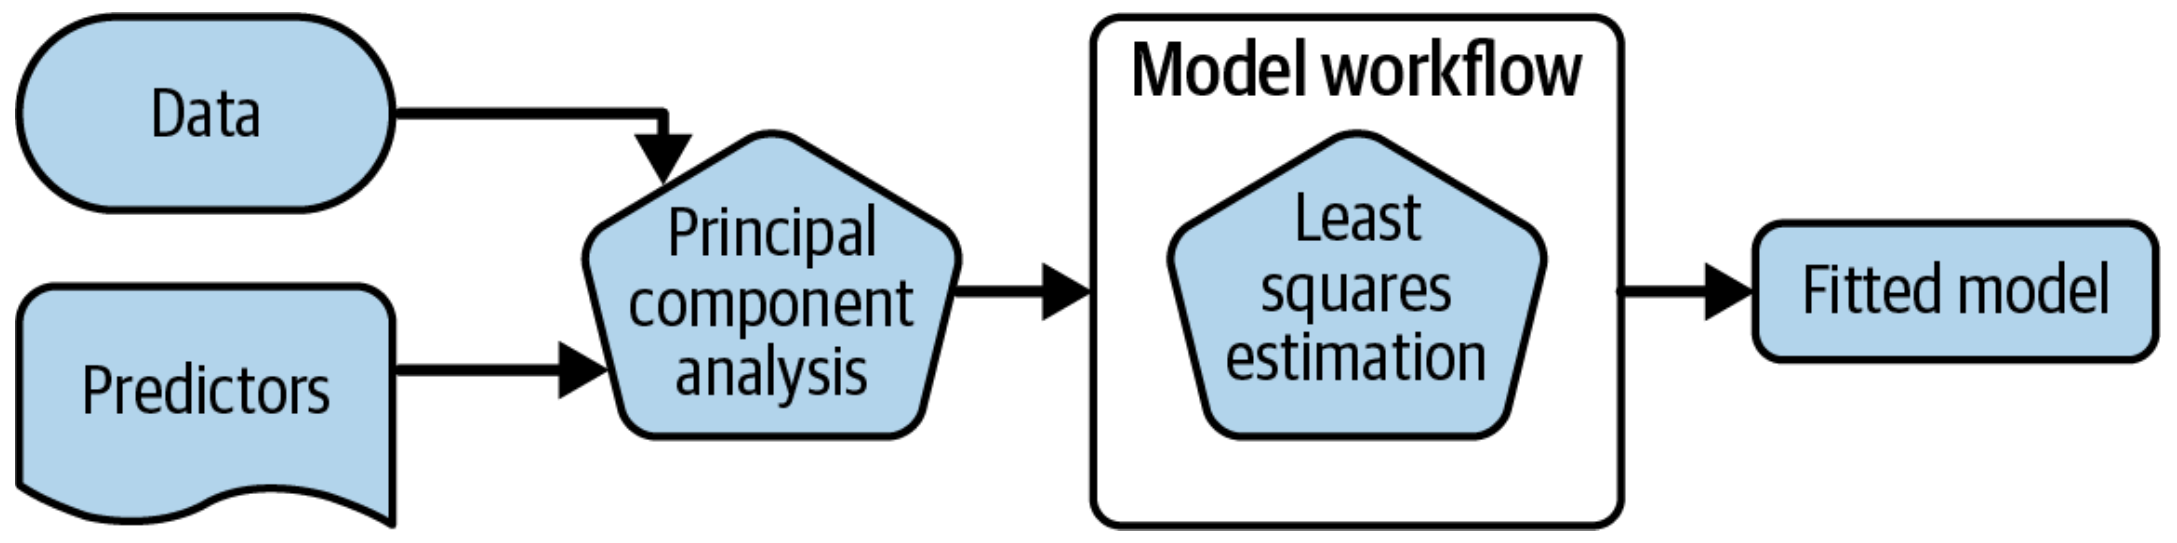
Deploy preprocessors and models together
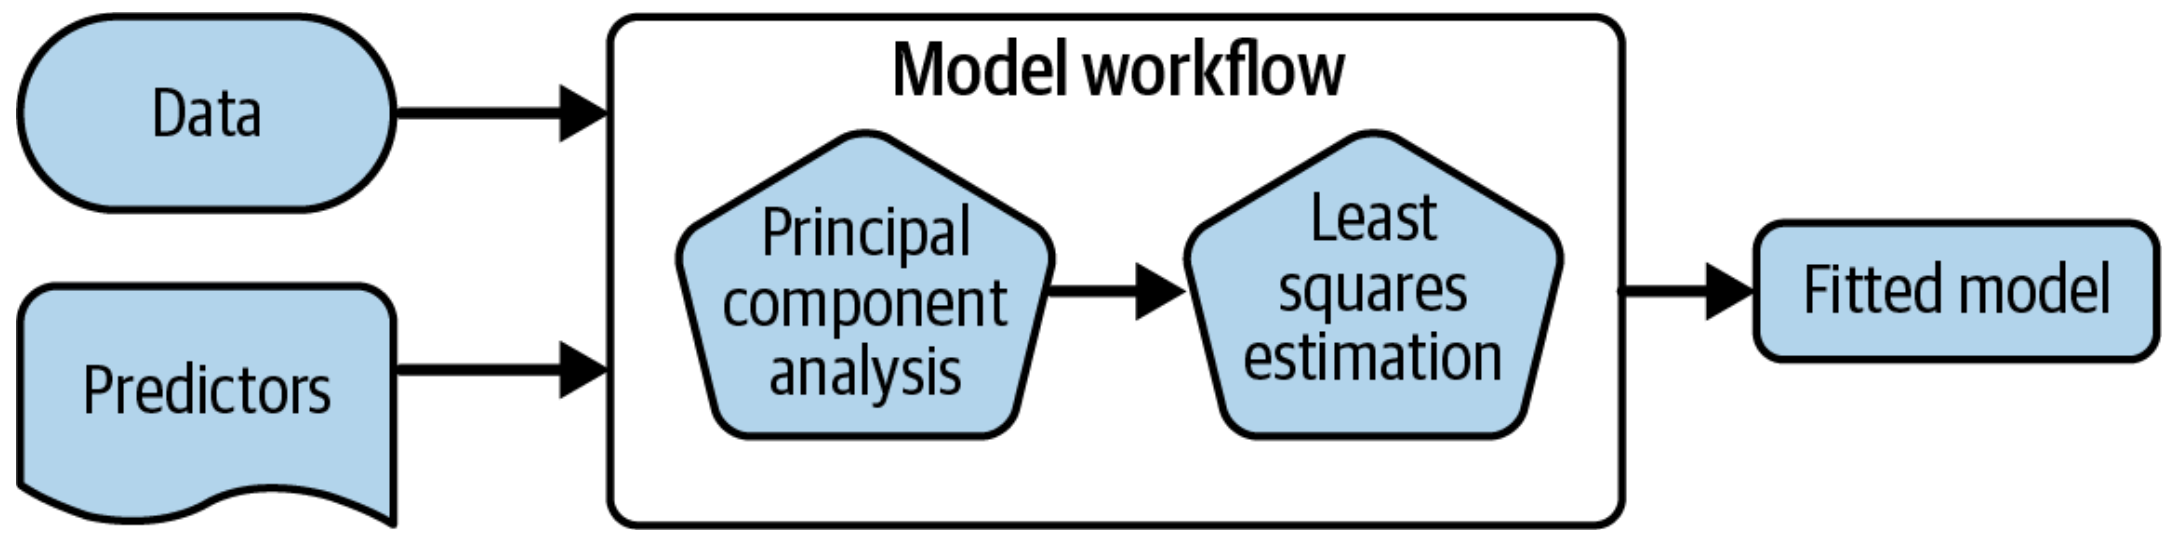
What is wrong with this?
Your turn 🏺
Activity
Create your vetiver model object.
Check out the default description that is created, and try out using a custom description.
Show your custom description to your neighbor.
05:00
Version your model
pins 📌
The pins package publishes data, models, and other R and Python objects, making it easy to share them across projects and with your colleagues.
You can pin objects to a variety of pin boards, including:
- a local folder (like a network drive or even a temporary directory)
- Posit Connect
- Amazon S3
- Azure Storage
- Google Cloud
Version your model
Learn about the pins package for Python and for R
from pins import board_temp
from vetiver import vetiver_pin_write

board = board_temp(allow_pickle_read = True)
vetiver_pin_write(board, v)
#> Model Cards provide a framework for transparent, responsible reporting.
#>  Use the vetiver `.qmd` Quarto template as a place to start,
#>  with vetiver.model_card()
#> Writing pin:
#> Name: 'seattle-housing-python'
#> Version: 20240812T004027Z-258d7library(pins)
board <- board_temp()
board |> vetiver_pin_write(v)
#> Creating new version '20240812T004027Z-f27f6'
#> Writing to pin 'seattle-housing-rstats'
#>
#> Create a Model Card for your published model
#> • Model Cards provide a framework for transparent, responsible reporting
#> • Use the vetiver `.Rmd` template as a place to startYour turn 🏺
Activity
Pin your vetiver model object to a temporary board.
Retrieve the model metadata with pin_meta().
05:00
Posit Connect
- Posit Connect is a publishing platform for data science
- For Python, generate an API key: https://docs.posit.co/connect/user/api-keys/
- For R, set up publishing from RStudio: https://docs.posit.co/connect/user/publishing/
Version your model
R
Python
Version your model
R
Python
from pins import board_connect
from vetiver import VetiverModel, vetiver_pin_write
from dotenv import load_dotenv
load_dotenv()

board = board_connect(allow_pickle_read = True)
v = VetiverModel(housing_fit, "isabel.zimmerman/seattle-housing-python", prototype_data = X_train)
vetiver_pin_write(board, v)
Your turn 🏺
Activity
Either:
- Set up Connect publishing from RStudio.
- Create an API key for your Posit Connect server, and save it on Workbench in your working directory (in
.Renvironfor R or.envfor Python).
Create a new vetiver model object that includes your username, and pin this vetiver model to your Connect instance.
Visit your pin’s homepage on Connect.
Train your model again, using a different ML algorithm (decision tree or random forest are good options).
Write this new version of your model to the same pin, and see what versions you have with pin_versions.
10:00